Predictive Maintenance ROI: 2026 Benchmarks for India
Predictive maintenance ROI is real but smaller than the brochure numbers. Companies that have actually deployed it report an average 9% uptime gain and 12% lower maintenance cost, according to PwC's survey of adopters. For Indian plants, where 88% face an unplanned outage every month, that is still a strong business case — if the model is accurate and wired into work orders.
Every vendor deck quotes the same three headline numbers. Few buyers ask where they came from, how old they are, or whether a mid-sized Indian plant will see anything close. This deep-dive lines up the benchmarks side by side, separates expectations from measured results, and turns them into a practical way to size the return before you spend.
TL;DR
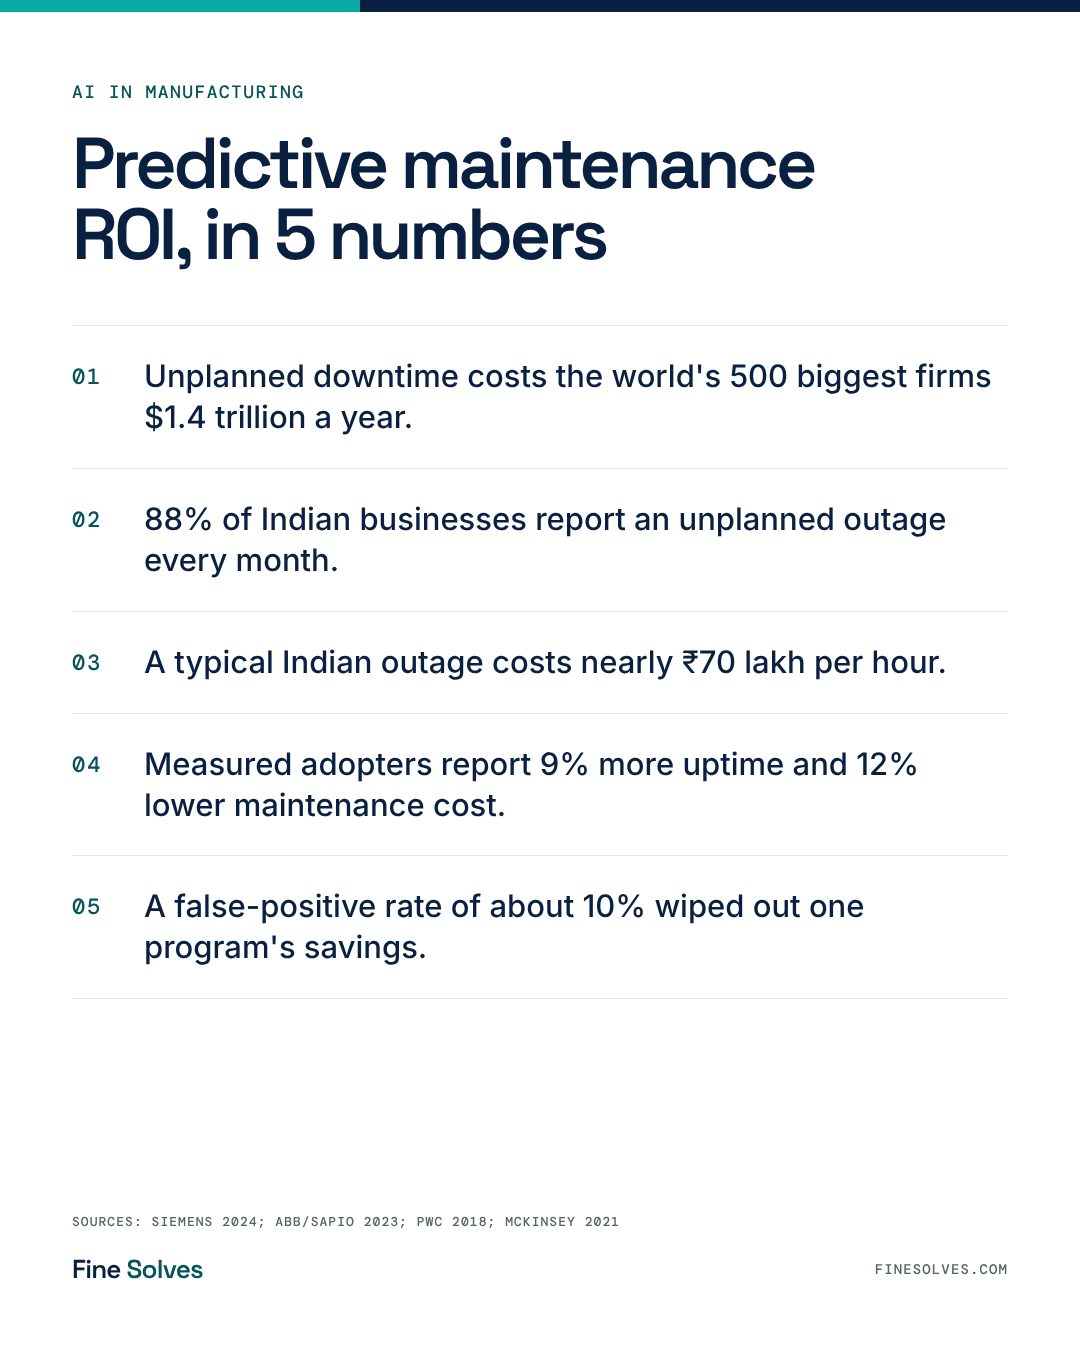
- Unplanned downtime costs the world's 500 biggest companies about $1.4 trillion a year, or 11% of revenue (Siemens, 2024).
- 88% of Indian businesses report at least one unplanned outage a month, against 69% globally (ABB).
- Headline claims promise 70% fewer breakdowns; measured adopters report 9% more uptime and 12% lower cost (PwC).
- A false-positive rate of about 10% was enough to wipe out one program's savings (McKinsey, 2021).
- India's predictive maintenance market is forecast to grow at 19.59% a year to 2034 (IMARC).
What does unplanned downtime cost a manufacturer?
Unplanned downtime costs the largest manufacturers about 11% of revenue, and a typical Indian plant nearly ₹70 lakh for every hour a line is down.
Siemens' True Cost of Downtime 2024 report estimates that unplanned stoppages cost the world's 500 biggest companies about $1.4 trillion a year. That figure fell 6% since 2022, but the per-hour cost keeps climbing in capital-heavy sectors. An hour of downtime in automotive now costs $2.3 million, roughly double the 2019 level. Even at the low end, FMCG lines lose about $36,000 an hour.
For India, ABB's survey of 3,215 maintenance decision-makers (run by Sapio Research) found the unplanned downtime cost for a typical Indian business is nearly ₹70 lakh per hour, against INR 10.3 million globally. Indian costs per hour are lower. Frequency is the problem.
Why are Indian plants more exposed?
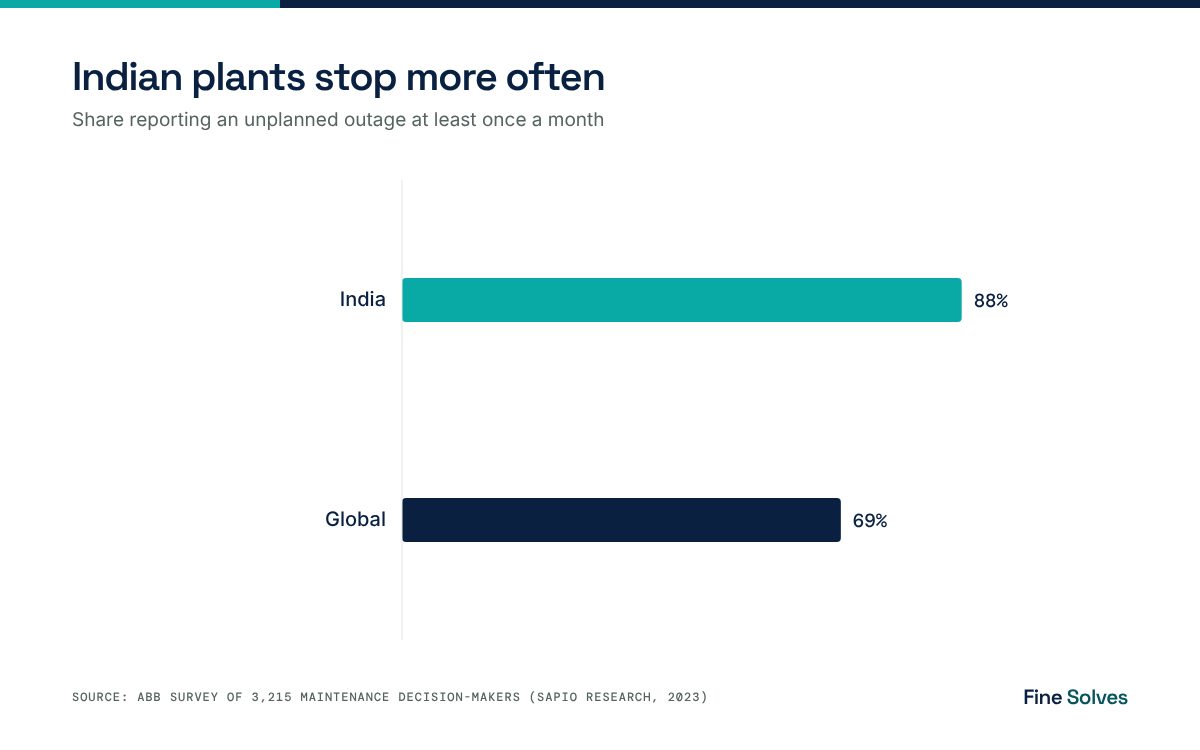
Indian plants stop more often: 88% report an unplanned outage at least once a month, and 19% still run equipment until it fails.
The ABB data puts the global figure for monthly outages at 69%, so Indian respondents are well above the average. The 19% that still rely on run-to-fail maintenance have no early warning at all. Add tight working-capital cycles, ageing imported machines with long spare-part lead times, and thin maintenance teams, and every surprise breakdown ripples through dispatch schedules and customer commitments.
The upside is large. NITI Aayog estimates AI could add USD 85 billion to USD 100 billion of value to Indian manufacturing by 2035, according to an ANI report, and asset uptime is one of the most direct routes to that value.
How much does AI predictive maintenance actually save?
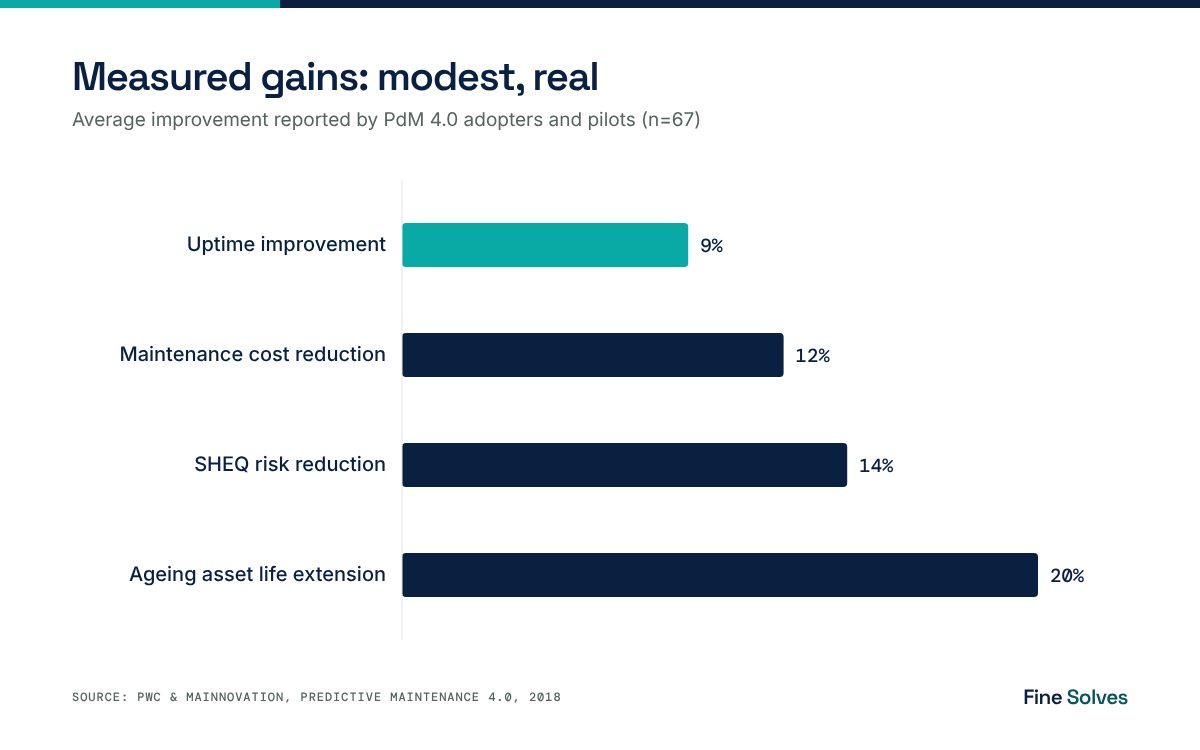
Measured results are modest but solid: adopters report 9% more uptime, 12% lower maintenance cost and 20% longer asset life on average.
The famous numbers are expectations. Deloitte's 2017 position paper says predictive maintenance raises productivity by 25%, cuts breakdowns by 70% and lowers maintenance costs by 25% on average. McKinsey's 2017 analysis says it typically reduces machine downtime by 30% to 50% and extends machine life by 20% to 40%. Both are widely repeated, and both describe what a well-run program can reach.
PwC and Mainnovation took a different route. They surveyed 268 companies and asked the 67 that were running AI predictive maintenance or pilots what they had measured. The averages: 9% uptime improvement, 12% cost reduction, 14% fewer safety, health, environment and quality risks, and 20% longer life for ageing assets. Only 11% of companies had reached full PdM 4.0 maturity.
| Study | Type | Downtime / uptime | Maintenance cost | Other |
|---|---|---|---|---|
| McKinsey (2017) | Typical range | Downtime −30% to −50% | — | Machine life +20% to +40% |
| Deloitte (2017), headline | Average claim | Breakdowns −70% | −25% | Productivity +25% |
| Deloitte (2017), detailed | Range | Uptime +10% to +20% | −5% to −10% | Planning time −20% to −50% |
| PwC & Mainnovation (2018) | Measured by adopters | Uptime +9% | −12% | Asset life +20%; risk −14% |
Source: McKinsey 2017; Deloitte Analytics Institute 2017; PwC & Mainnovation, Predictive Maintenance 4.0, 2018.
Why do some predictive maintenance programs lose money?
They lose money when false alarms send technicians to healthy machines, or when predictions never turn into scheduled work orders.
McKinsey's 2021 review describes a company whose model had a false-positive rate of about 10%. That created roughly 1,000 extra service cases a year and, in McKinsey's words, wiped out the overall savings — on a program management expected to save more than a million dollars a year. The same review notes another firm that predicted about one-quarter of its breakdowns with 85% accuracy and still saved money, because it targeted the right failures.
The lesson is that model precision matters more than coverage. Predicting fewer failures correctly beats flagging everything.
Is downtime getting better or worse?
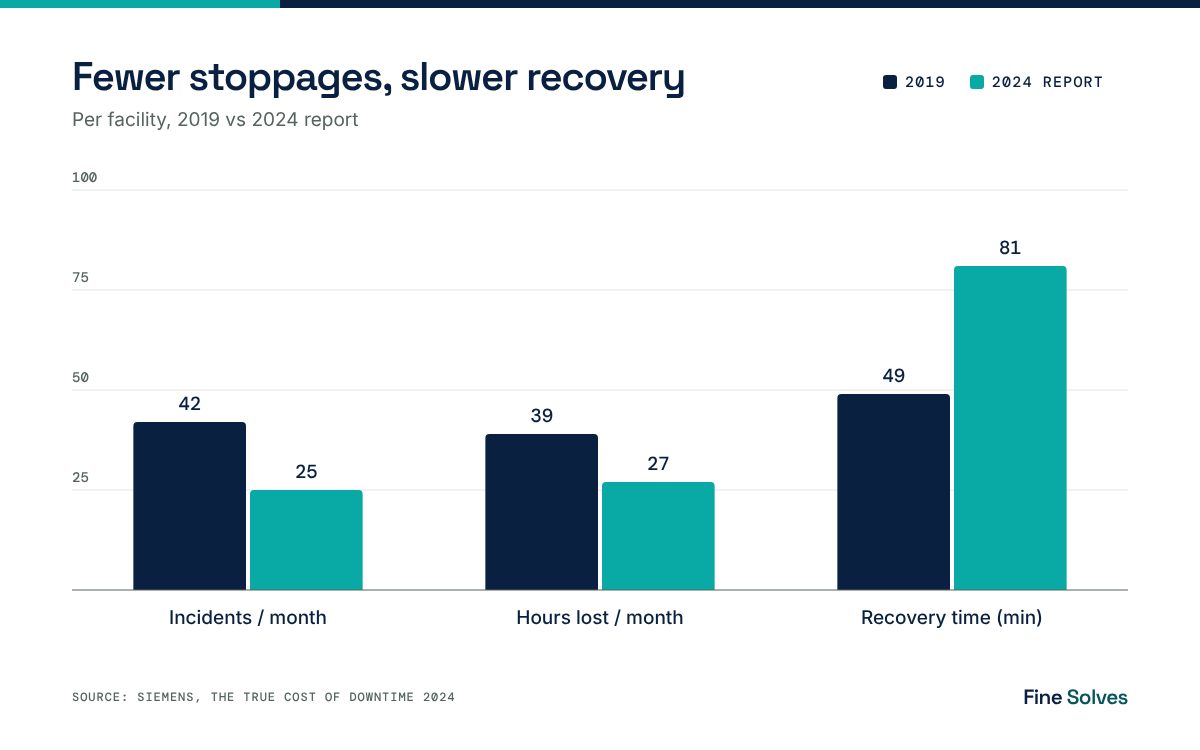
Stoppages are less frequent than in 2019, but each one now takes longer to fix, and in automotive and heavy industry each hour costs more.
Siemens found downtime incidents fell from 42 to 25 per facility per month, a 41% drop, and hours lost fell from 39 to 27 per month. But average recovery time rose from 49 minutes to 81 minutes. Faster diagnosis is where condition monitoring and guided troubleshooting earn their keep.
| Per facility | 2019 | 2024 report |
|---|---|---|
| Downtime incidents per month | 42 | 25 |
| Hours lost per month | 39 | 27 |
| Average recovery time (minutes) | 49 | 81 |
Source: Siemens, The True Cost of Downtime 2024.
How do you calculate predictive maintenance ROI for your plant?
Multiply avoided downtime hours by your real cost per hour, add maintenance savings, then subtract sensors, software, integration and false-alarm costs.
- Baseline one line, not the plant. Pull 12 months of breakdown logs for your top five critical assets: hours down, cause, parts used.
- Price an hour honestly. Include lost output, overtime, scrap, expedited freight and penalty clauses. Use ₹70 lakh as a sense check, not as your number.
- Use measured benchmarks, not headlines. Model the base case on PwC's 9% uptime and 12% cost figures. Treat McKinsey's 30% to 50% downtime range as the upside.
- Budget for false positives. Every false alarm is a technician visit. Set a precision target before you buy, and test it on your own history.
- Wire predictions into work orders. An alert that sits in a dashboard saves nothing. It has to create a job in your CMMS or ERP with parts reserved.
- Review at 90 days. Compare downtime hours and maintenance spend against the baseline. Expand only if the pilot line pays.
Should you buy a platform or build a custom system?
Buy when your assets are standard and well supported; build when data sits in older PLCs, spreadsheets and an ERP that off-the-shelf tools cannot read.
Most Indian mid-sized plants run a mix of new and decades-old equipment. Packaged platforms handle common motors, pumps and compressors well. They struggle with legacy controllers, custom machines and maintenance history kept in Excel. From the way we build at Fine Solves, the expensive part is rarely the model. It is getting clean sensor and maintenance data into one place, then closing the loop into the tools your technicians already use.
What this means for Indian businesses
The market is moving. IMARC sizes India's predictive maintenance market at USD 558.1 million in 2025 and forecasts USD 2,922.0 million by 2034. PwC found 60% of companies had concrete plans to deploy PdM 4.0, and 95% said it improves at least one key maintenance metric. For an Indian plant with monthly outages, even the conservative measured gains justify a pilot on the assets that hurt most.
Start with one line, set a precision target, and connect predictions to action. If you want a second pair of eyes on the business case or the data plumbing, Talk to Fine Solves.
Frequently asked questions
What is a realistic predictive maintenance ROI?
Measured results are more modest than vendor claims. Companies running AI predictive maintenance or pilots reported an average 9% uptime improvement, 12% lower maintenance cost and 20% longer life for ageing assets, according to PwC and Mainnovation. Headline figures such as 70% fewer breakdowns describe what top programs can reach, not the average result.
How much does unplanned downtime cost Indian manufacturers?
ABB's global survey found an unplanned outage costs a typical Indian business nearly ₹70 lakh per hour, and 88% of Indian businesses face at least one unplanned outage a month. The hourly cost is lower than the global figure, but outages happen more often, so the annual loss is still significant.
What is the difference between predictive and preventive maintenance?
Preventive maintenance services equipment on a fixed calendar or usage schedule, whether it needs it or not. Predictive maintenance uses condition monitoring data, such as vibration, temperature or current, and models to service a machine only when signs of failure appear. Done well, it cuts both breakdowns and unnecessary routine work.
Why do predictive maintenance projects fail?
The most common causes are false alarms, poor data and no link to action. McKinsey describes a program where a false-positive rate of about 10% created roughly 1,000 extra service cases a year and wiped out the expected savings. Predictions that never become scheduled work orders also deliver nothing.
Which assets should an Indian plant start with?
Start with the five assets that caused the most downtime hours in the last 12 months, especially those with long spare-part lead times. Rotating equipment such as motors, pumps, compressors and gearboxes is usually easiest to monitor. Prove the return on one line before rolling out across the plant.
Sources
- The True Cost of Downtime 2024 — Siemens, 2024
- ABB survey on unplanned downtime in India — EPC World, 2023
- AI-based predictive maintenance and Indian manufacturing (ABB, NITI Aayog figures) — ANI via Asianet Newsable, 2026
- Predictive Maintenance Position Paper — Deloitte Analytics Institute, 2017
- Manufacturing: Analytics unleashes productivity and profitability — McKinsey & Company, 2017
- Establishing the right analytics-based maintenance strategy — McKinsey & Company, 2021
- Predictive Maintenance 4.0: Beyond the hype — PwC & Mainnovation, 2018
- India Predictive Maintenance Market Report — IMARC Group
Last updated: 31 October 2026. Published by Fine Solves — an AI software development company in Ahmedabad building custom software and AI systems for Indian businesses. finesolves.com