
Festive E-commerce 2026: Quick Commerce Orders Up 75%
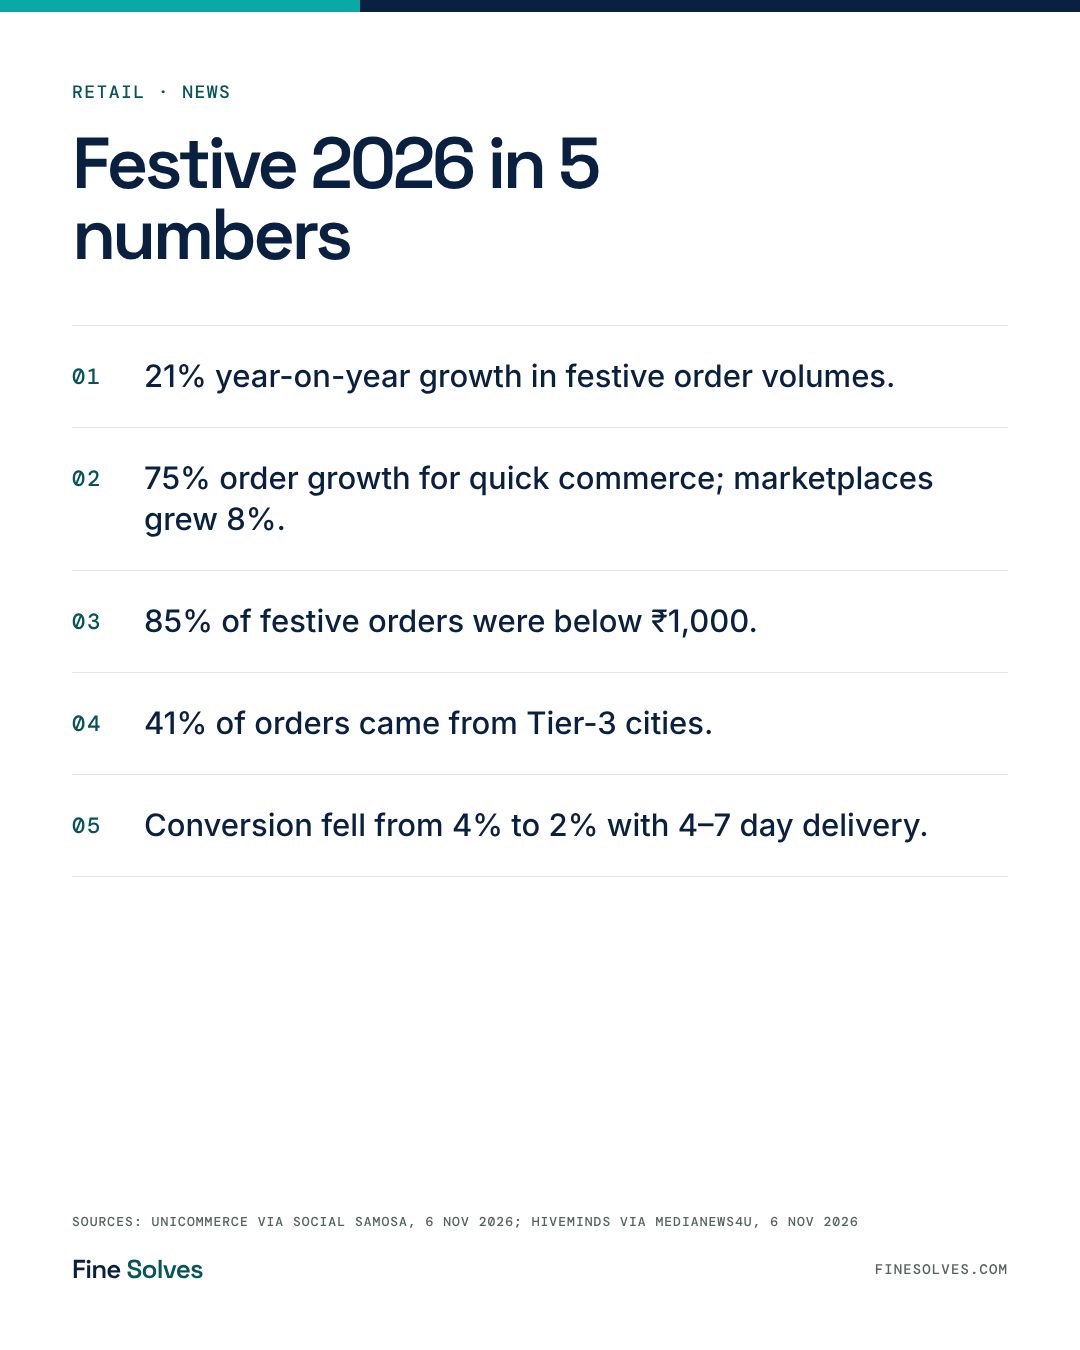
Festive e-commerce 2026 in India grew order volumes 21% year-on-year, according to Unicommerce data released on 6 November, and quick commerce grew fastest at 75%. Marketplaces grew only 8%. Small baskets dominated: orders below ₹1,000 were 85% of all festive orders. For retailers and D2C brands, the demand moved to faster channels and smaller towns.
The festive sale is the year's stress test for Indian retail operations. It decides how much inventory sits where, how many delivery partners you contract, and how much ad budget you can burn before margins break. This year's numbers arrived in the same week from two independent sources: Unicommerce's order-level analysis and a HiveMinds view of ad performance. Read together with Redseer's pre-season forecast, they show a festive season that was bigger, faster and more concentrated than last year's, and harder on any supply chain still planned around weekly replenishment.
TL;DR
- Festive order volumes rose 21% year-on-year across over 138 million order items, Unicommerce found.
- Quick commerce orders grew 75% and GMV 38%; D2C brand websites grew orders 30%; marketplaces grew 8%.
- Tier-3 cities took 41% of festive orders, more than Tier-1 and metro markets at 34%.
- Prepaid orders were 61% of the total, and Tier-3 prepaid volumes grew by over 40%.
- Return on ad spend reached nearly 48x against about 22x last festive season, HiveMinds reported, but clicks cost up to 2.5x normal.
What happened in festive e-commerce 2026?
Festive e-commerce 2026 order volumes grew 21% year-on-year, led by quick commerce at 75%, according to Unicommerce's analysis of the 6 October to 4 November 2026 sale period.
Unicommerce compared that window with 17 September to 16 October 2025, the matching festive period last year, using over 138 million order items processed through its Uniware platform. That is a large sample, but it is one platform's view: it covers brands and sellers that run on Uniware, not the whole market. Still, it is the most detailed order-level read published so far this season. Redseer had forecast festive growth of about 25%, with GMV between $15 billion and $16 billion from between 180 million and 185 million online shoppers. Order growth and market growth are different measures, but the realised figure sits a little below that forecast.
Which channels grew fastest this festive season?
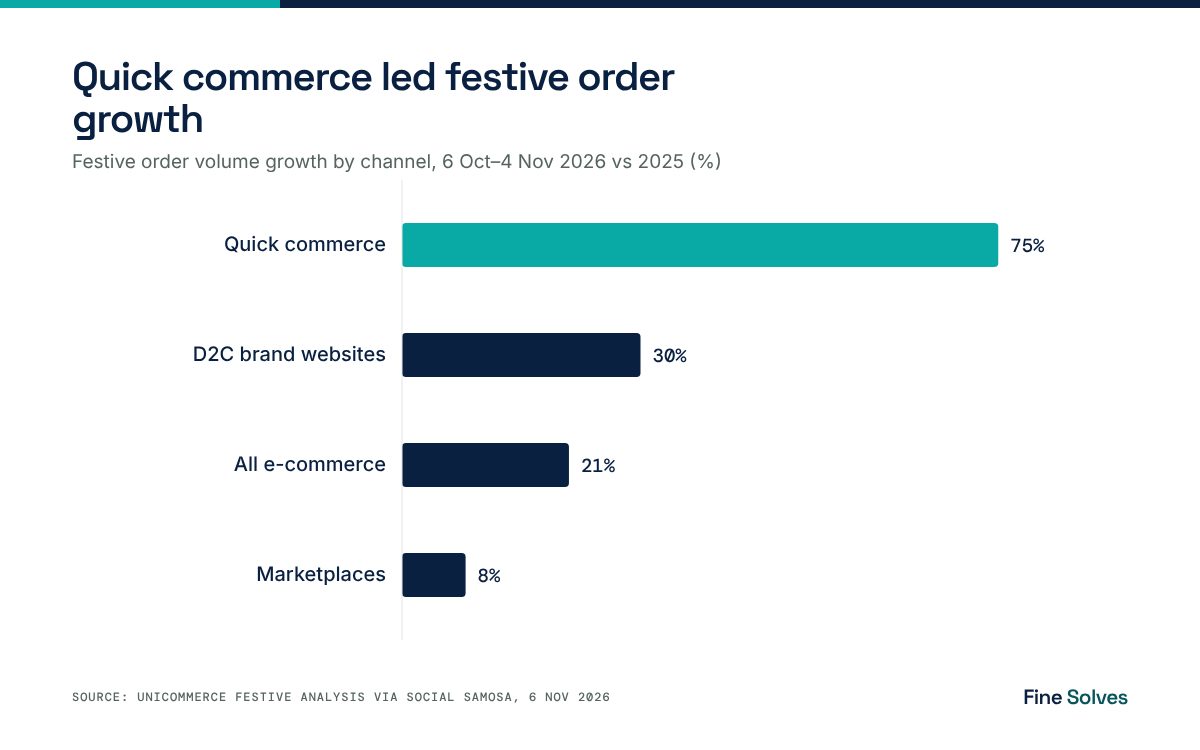
Quick commerce grew fastest, with order volumes up 75% and GMV up 38%, followed by D2C brand websites at 30%. Marketplaces lagged at 8%, Unicommerce reported.
The gap between order growth and GMV growth matters. Quick commerce orders grew almost twice as fast as quick commerce GMV, which means the average basket shrank. The same pattern showed up across the market: orders valued below ₹1,000 made up 85% of all festive orders. D2C brand websites grew GMV 26% on 30% more orders, so their baskets held up better. Marketplaces grew orders 8% and GMV 6%, the slowest of the three channels by both measures.
| Channel | Order volume growth (YoY) | GMV growth (YoY) |
|---|---|---|
| Quick commerce | 75% | 38% |
| D2C brand websites | 30% | 26% |
| Marketplaces | 8% | 6% |
| All e-commerce (Uniware sample) | 21% | Not reported |
Source: Unicommerce festive analysis, 6 October–4 November 2026, as reported by Social Samosa (6 November 2026).
Redseer's numbers explain why quick commerce keeps taking share. It estimates quick commerce reached about $9 billion in the first half of 2026 with about 60 million monthly transacting users, and expected festive quick commerce growth of 110% to 120%. Unicommerce's 75% is lower, but its sample covers brands and sellers on one software platform, not the quick commerce platforms' total volumes, so the two figures measure different things.
Did growth slow after the first festive week?
Yes. In the first week, Unicommerce reported 31% order growth and 85% quick commerce growth; across the full season those cooled to 21% and 75%.
The first-week analysis, published on 14 October and covering more than 33 million order items, compared 7–13 October 2026 with 22–28 September 2025. It also found GMV up 17% while average order value fell 10%, FMCG orders up more than 190%, and beauty and personal care orders up more than 69%. HiveMinds saw the same front-loading in its ad data: the first four days carried around 60% of the whole sale. The operational lesson is blunt. Most of the season's demand lands in the first few days, so stock that is not in position before day one mostly misses the sale.
Why are Tier-3 cities now the biggest festive market?
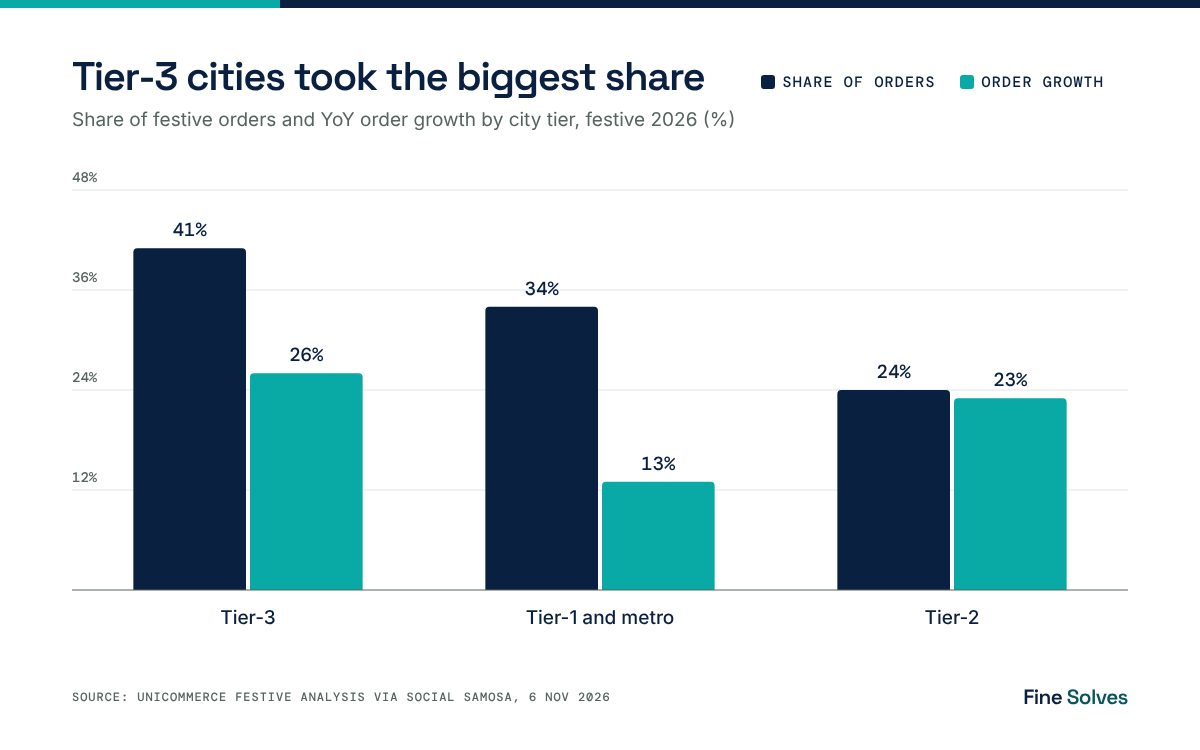
Tier-3 cities took 41% of festive orders and grew 26%, while Tier-1 and metro markets took 34% and grew only 13%, Unicommerce data shows.
Tier-2 cities contributed 24% of orders and grew 23%. So the two smaller tiers together produced about two-thirds of orders and grew roughly twice as fast as the big cities. The first-week data had already shown it, with Tier 3 towns at 42% of orders. Payment behaviour is shifting with it: prepaid transactions were 61% of all festive orders, and Tier-3 prepaid volumes grew by over 40%. That matters for cost. Fewer cash-on-delivery orders in small towns usually means fewer refused deliveries and less reverse logistics, which has historically been the hidden cost of serving these markets.
| City tier | Share of festive orders | Order growth (YoY) |
|---|---|---|
| Tier-3 cities | 41% | 26% |
| Tier-1 and metro | 34% | 13% |
| Tier-2 cities | 24% | 23% |
Source: Unicommerce festive analysis, 6 October–4 November 2026, as reported by Social Samosa (6 November 2026).
Did festive ad spend pay off in 2026?
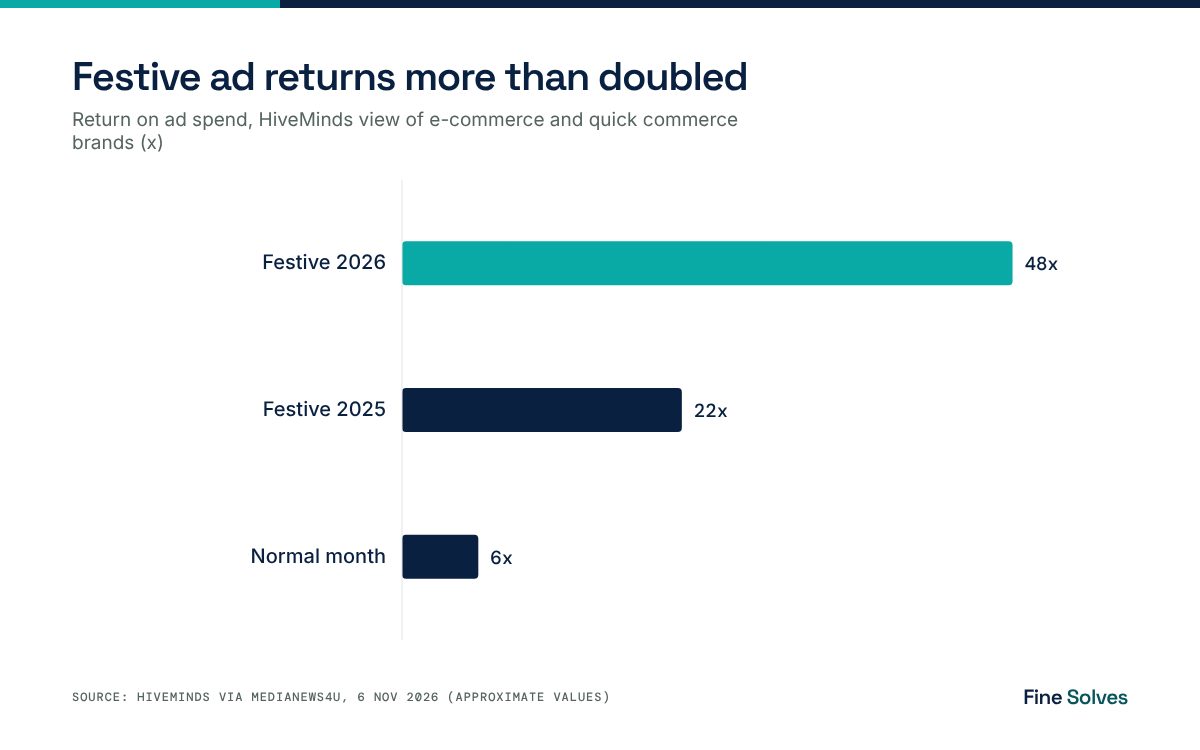
For many brands it did: HiveMinds reported return on ad spend of nearly 48x through the festive period, against about 22x last festive season and about 6x in a normal month.
The same HiveMinds view found daily orders were roughly 3.6x last year's festive pace and conversion was nearly 8x its normal-month level. The cost side moved too. Clicks cost up to 2.5x their normal price, and fashion needed about 10x the spend for about 6x the sales. The most useful finding for operations teams is about delivery promise: conversion dropped from 4% to 2% when delivery timelines shifted from next-day to 4–7 days. Half the conversions disappeared because of a logistics number shown on the product page.
Where did AI show up in this year's festive operations?
AI showed up mostly in customer engagement and fulfilment: Unicommerce reported 1.5 lakh AI-led automated calls to undecided buyers and a 30% improvement in delivery times versus last year.
Neither figure is a market-wide measure; both come from Unicommerce's own platform in the first festive week. But they point at where the returns are. Automated calls work on the cash-on-delivery and abandoned-cart problem, which is largest in exactly the Tier-2 and Tier-3 towns that drove growth. Faster delivery feeds the conversion effect HiveMinds measured. The less visible AI work sits upstream: forecasting demand by pin code and SKU so that stock is already in the right dark store or warehouse before the first four days, which carried around 60% of the sale.
How should retailers and D2C brands prepare for the next sale?
Plan inventory and delivery capacity for the first four days, by pin code, and treat the delivery promise as a conversion lever rather than a logistics afterthought.
- Forecast at pin-code and SKU level, not region level. With Tier-3 cities at 41% of orders, a regional forecast hides the towns where you will stock out.
- Pre-position stock before day one. If around 60% of the sale lands in four days, replenishment during the sale is too late for most SKUs.
- Design for small baskets. With 85% of orders below ₹1,000, pick-pack cost and last-mile cost per order decide margin. Measure them per order, not per rupee of GMV.
- Show the fastest honest delivery date. The drop from 4% to 2% conversion is the price of a slow promise. Tie the promise to real inventory location.
- Push prepaid in smaller towns. Prepaid is already 61% of orders; nudging the rest with automated confirmation calls cuts refused deliveries.
- Cap ad bids by contribution margin. A 48x ROAS can still lose money if clicks cost 2.5x and baskets are small. Bid on margin, not revenue.
What this means for Indian businesses
This year's festive data says demand is moving to quick commerce, D2C sites and smaller towns, and it arrives in a short burst. That rewards brands whose order, inventory and delivery systems talk to each other in near real time, and punishes those that reconcile channels in spreadsheets after the sale.
For most mid-market retailers and consumer brands, the gap is not a new storefront. It is the plumbing: a single inventory view across marketplaces, quick commerce and the brand site, pin-code demand forecasts, and delivery promises calculated from where the stock actually is. From the way we build these systems, the integration work matters more than the model. If you are planning that work before the next sale season, Talk to Fine Solves.
Frequently asked questions
How much did festive e-commerce grow in India in 2026?
Order volumes grew 21% year-on-year between 6 October and 4 November 2026, according to Unicommerce's analysis of over 138 million order items on its Uniware platform. Redseer had forecast festive growth of about 25%, with GMV between $15 billion and $16 billion. The Unicommerce figure is one platform's sample, so treat it as a strong indicator rather than a full market total.
How fast did quick commerce grow during the 2026 festive season?
Quick commerce order volumes grew 75% and GMV grew 38% over the full festive period, Unicommerce reported, after 85% order growth in the first week. Redseer's pre-season forecast expected festive quick commerce growth of 110% to 120%, but that forecast covers the whole quick commerce market rather than brands on one software platform.
What share of festive orders came from Tier-3 cities?
Tier-3 cities accounted for 41% of festive order volumes in 2026 and grew 26% year-on-year, according to Unicommerce. Tier-2 cities contributed 24% and Tier-1 and metro markets 34%. Smaller towns are now the largest single block of festive e-commerce demand and are growing faster than big cities.
Why does delivery speed matter so much for festive sales?
Because it changes conversion directly. HiveMinds found that conversion dropped from 4% to 2% when delivery timelines shifted from next-day to 4–7 days. With around 60% of the sale landing in the first four days, brands that cannot promise fast delivery in that window lose most of the season's demand.
How are Indian e-commerce brands using AI during festive sales?
The clearest examples are customer engagement and fulfilment. Unicommerce reported 1.5 lakh AI-led automated calls to undecided buyers and a 30% improvement in delivery times in the first festive week. Demand forecasting by pin code and SKU, and automated order confirmation for cash-on-delivery, are the other common uses.
Sources
- India's festive e-commerce orders grow 21% in 2026, quick commerce volumes surge 75% (Unicommerce analysis) — Social Samosa, 2026
- India's festive e-commerce orders jump 31 per cent as quick commerce surges 85 per cent: Unicommerce — Indian Television, 2026
- Unicommerce Reports 31% Festive Order Growth — Fashion Value Chain, 2026
- India Online Retail 2026: H1 Review, Festive and CY2026 Outlook — Redseer Strategy Consultants, 2026
- India's 2026 Festive Shoppers Came to Buy, Not to Browse: HiveMinds — MediaNews4U, 2026
Last updated: 8 November 2026. Published by Fine Solves — an AI software development company in Ahmedabad building custom software and AI systems for Indian businesses. finesolves.com